Projects
A collection of projects showcasing my work in business analytics, data visualization, and machine learning. These include Tableau dashboards, predictive models in Python, and actionable insights driven by CRISP-DM methodology.
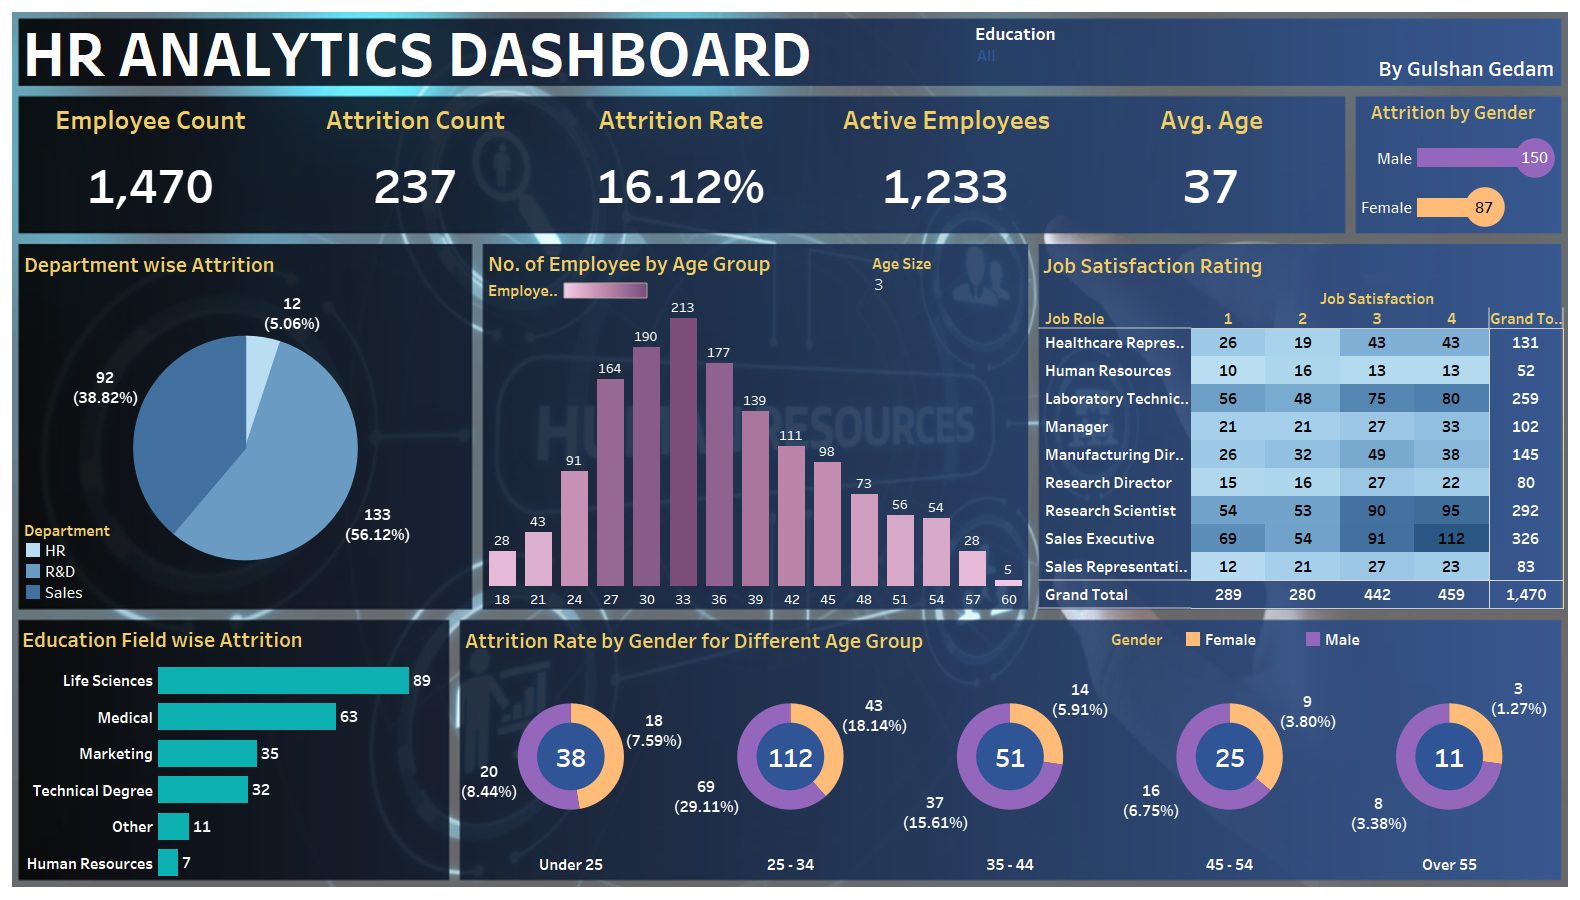
HR Analytics Dashboard
Created an interactive HR dashboard using Tableau (IBM HR dataset) to visualize attrition trends, employee demographics, and satisfaction scores. Integrated KPIs, heatmaps, and filters for actionable insight delivery to stakeholders.
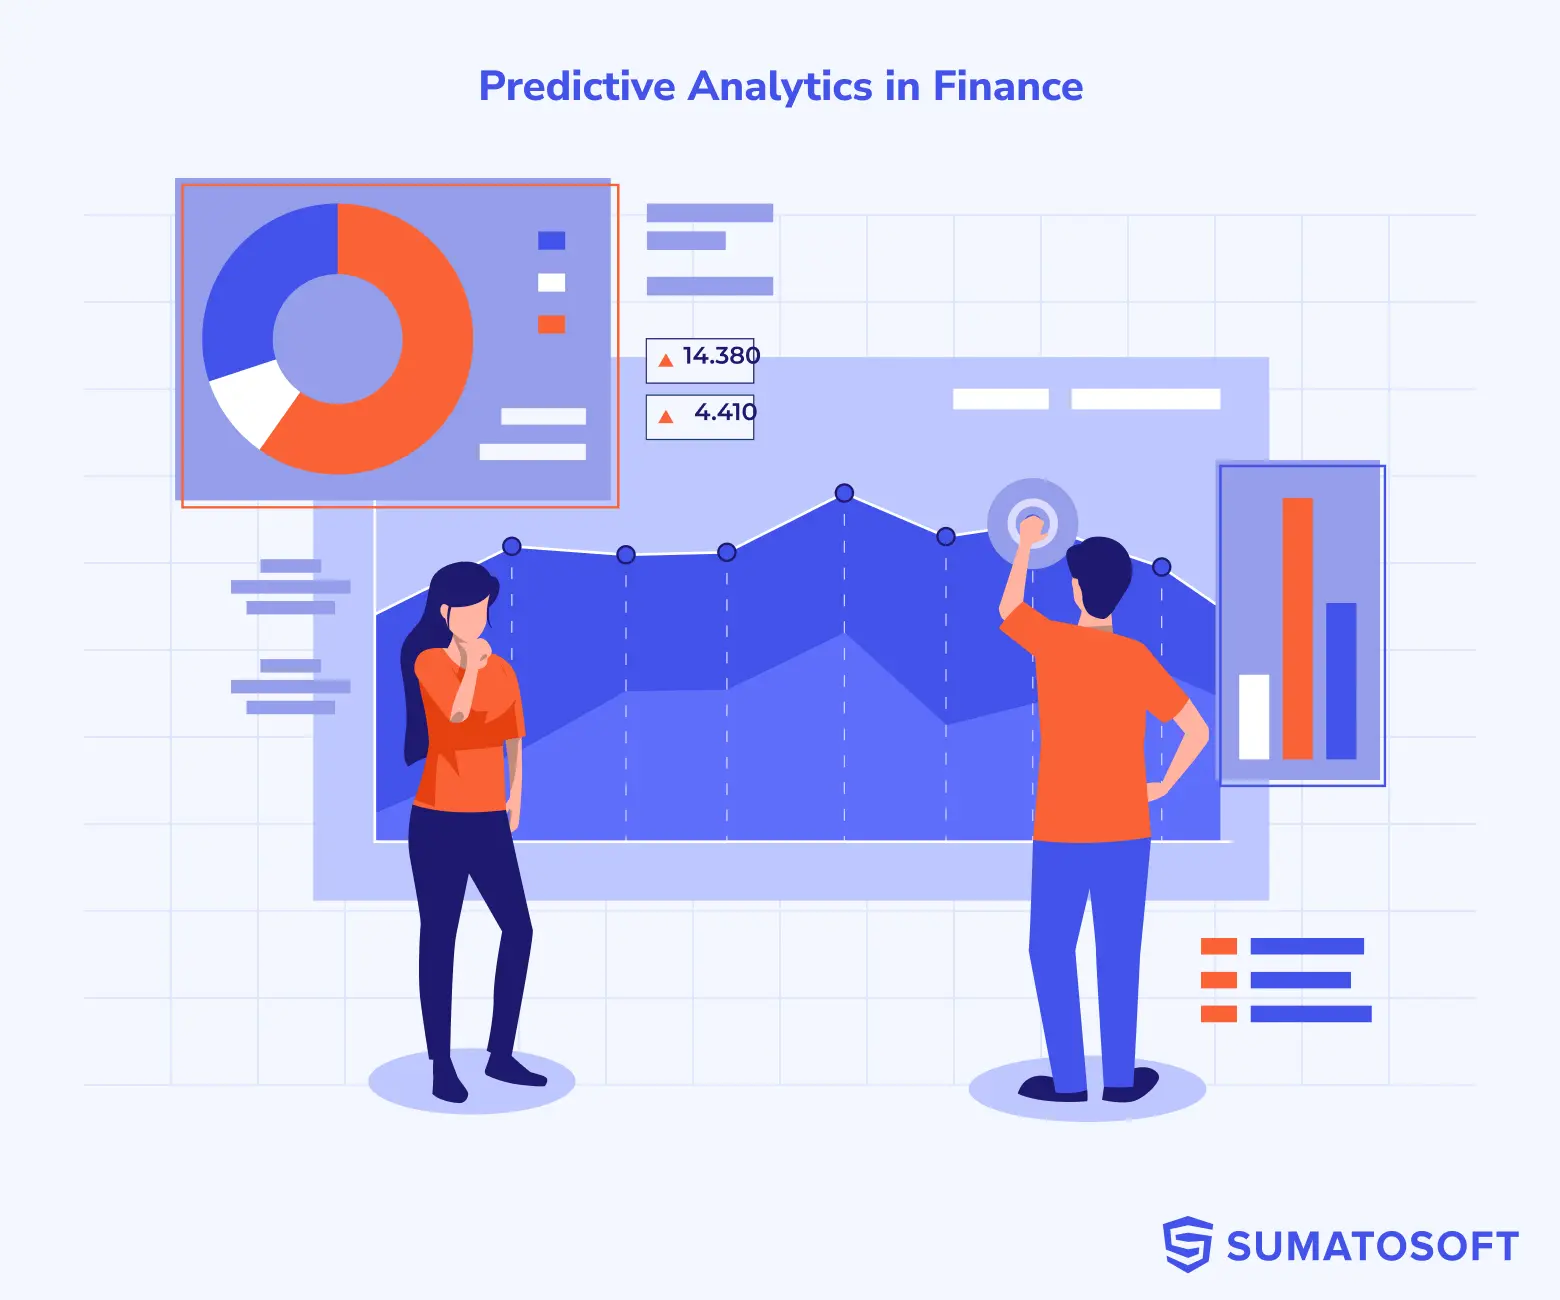
Predictive Analytics – Credit Risk & Churn Modeling
Developed machine learning models including Random Forest, SVM, XGBoost, and LSTM to predict credit risk and customer churn. Achieved over 95% accuracy and applied SHAP for model interpretability. Followed CRISP-DM methodology throughout.
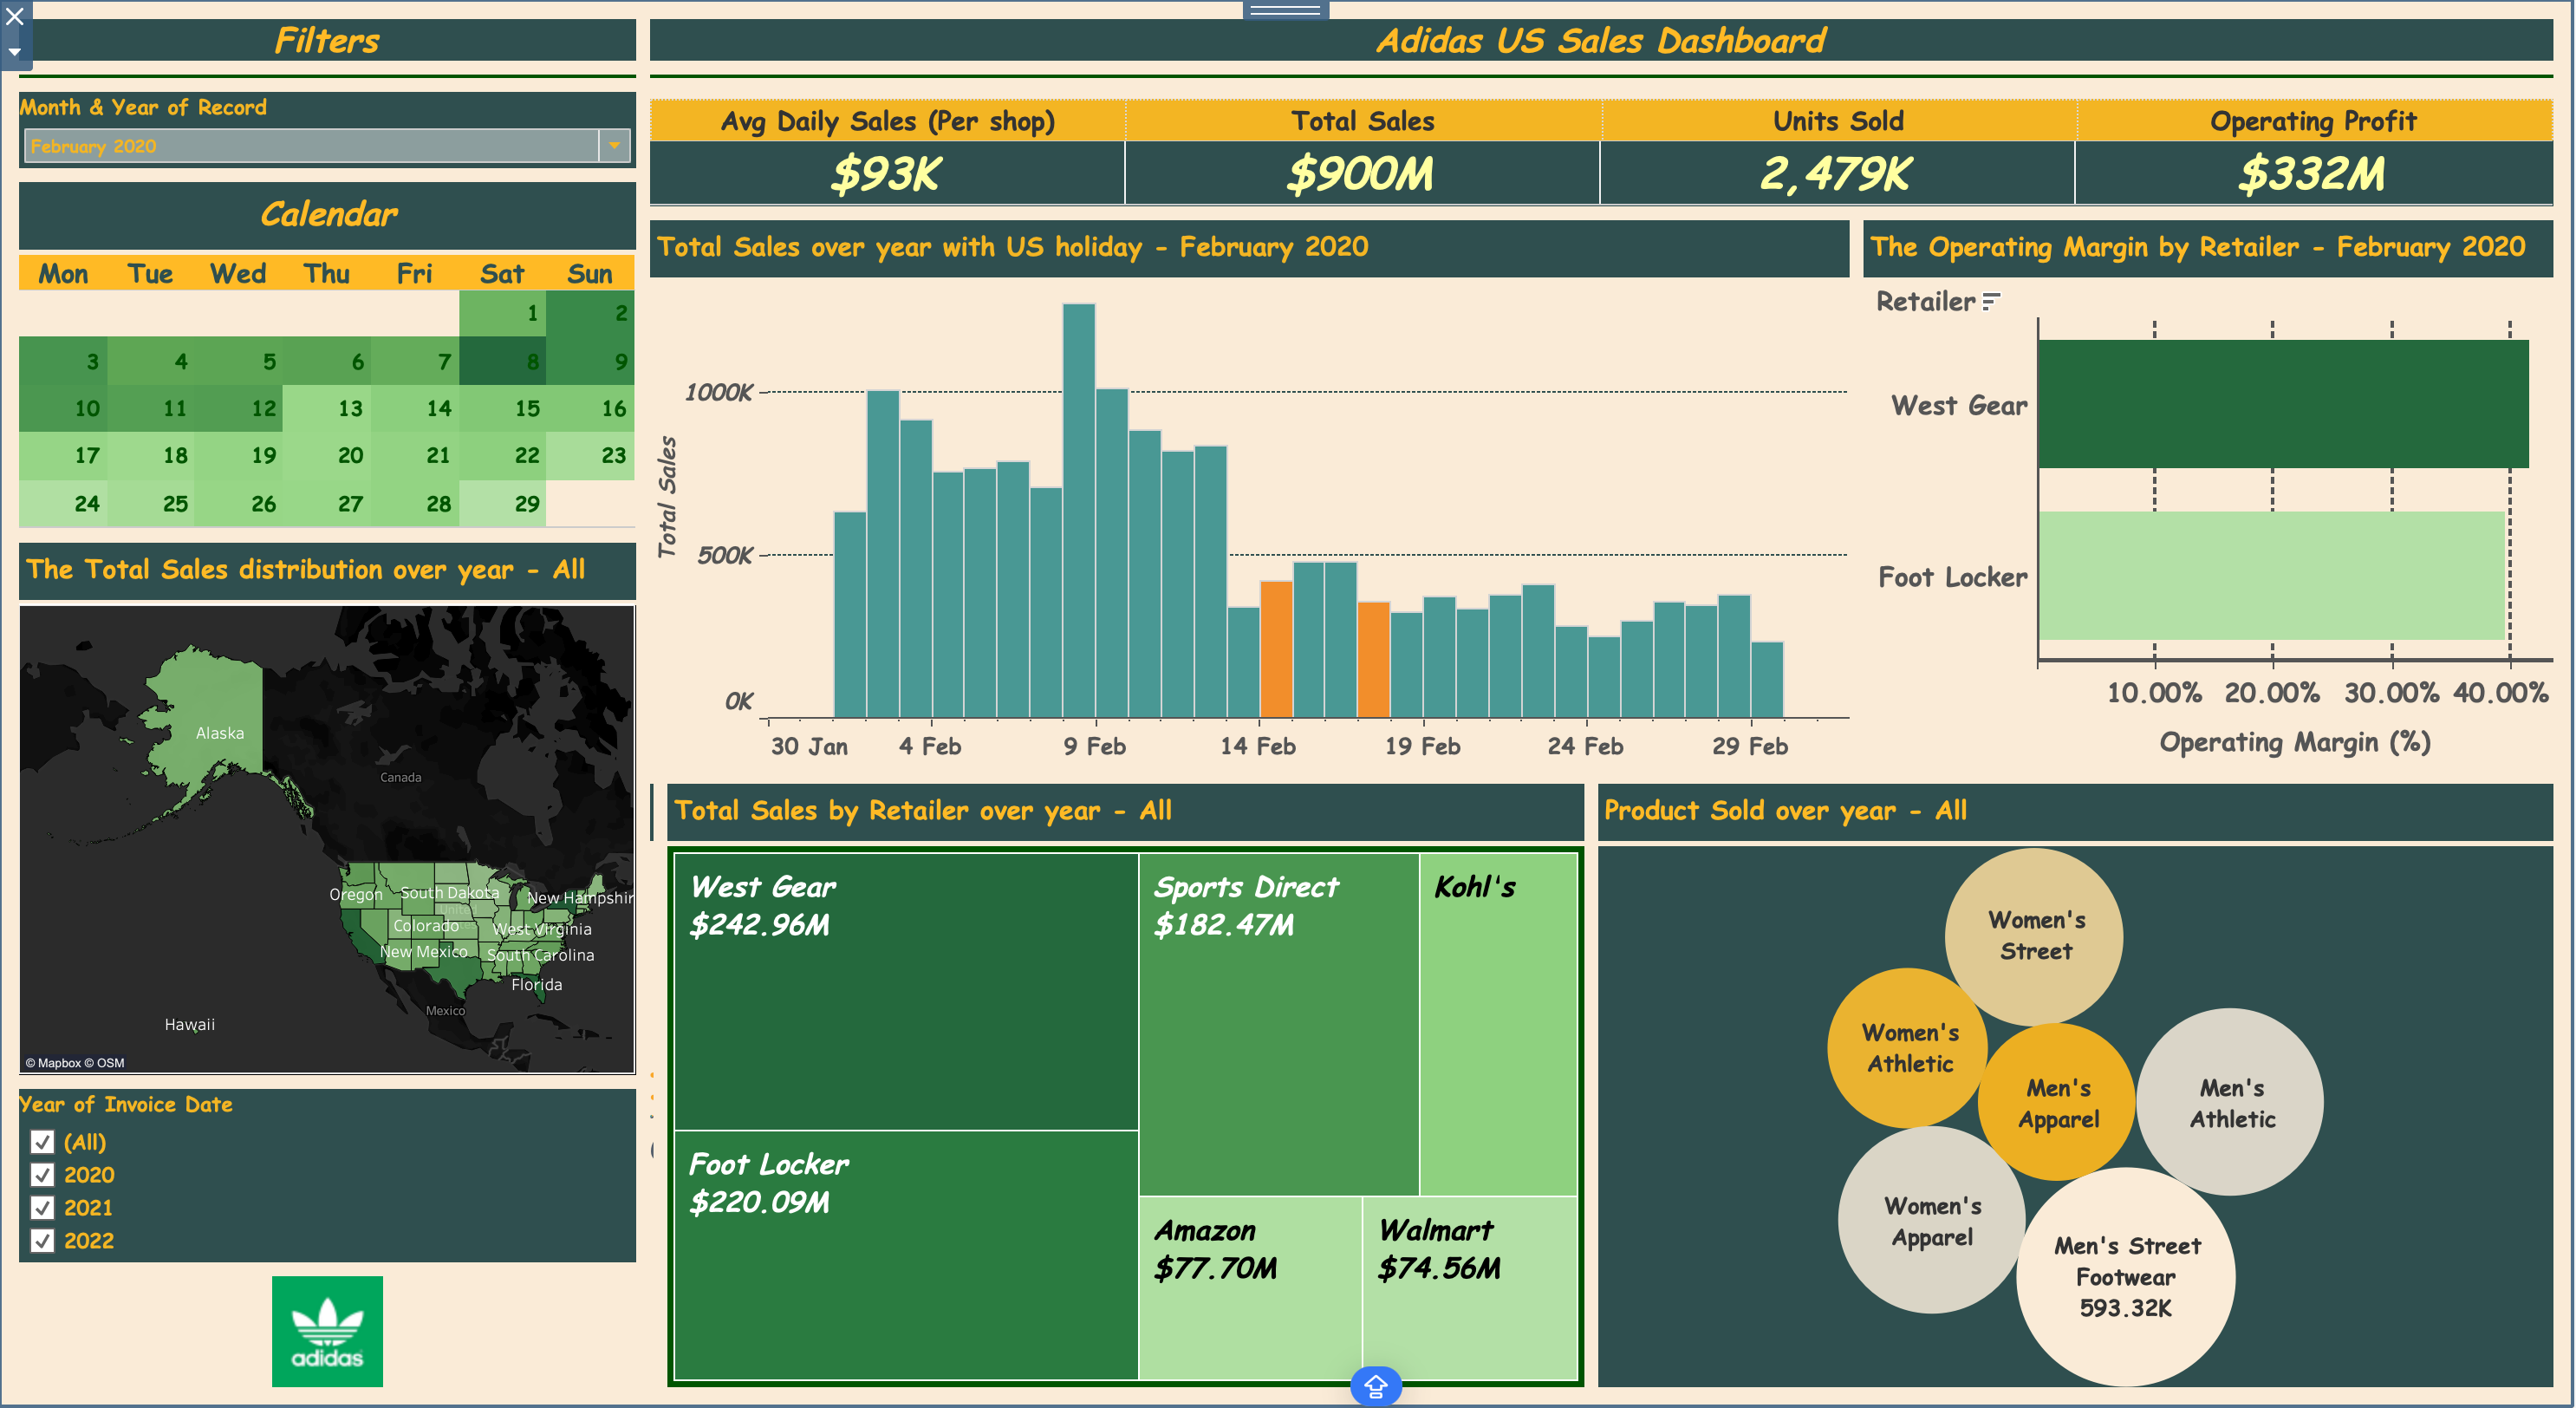
Adidas US Sales Dashboard
Built an interactive sales performance dashboard using Tableau to analyze Adidas's US market data. Visualized KPIs such as total sales, operating profit, daily sales trends, and product performance. Included map-based and holiday-based filters to enable detailed geographic and temporal analysis.
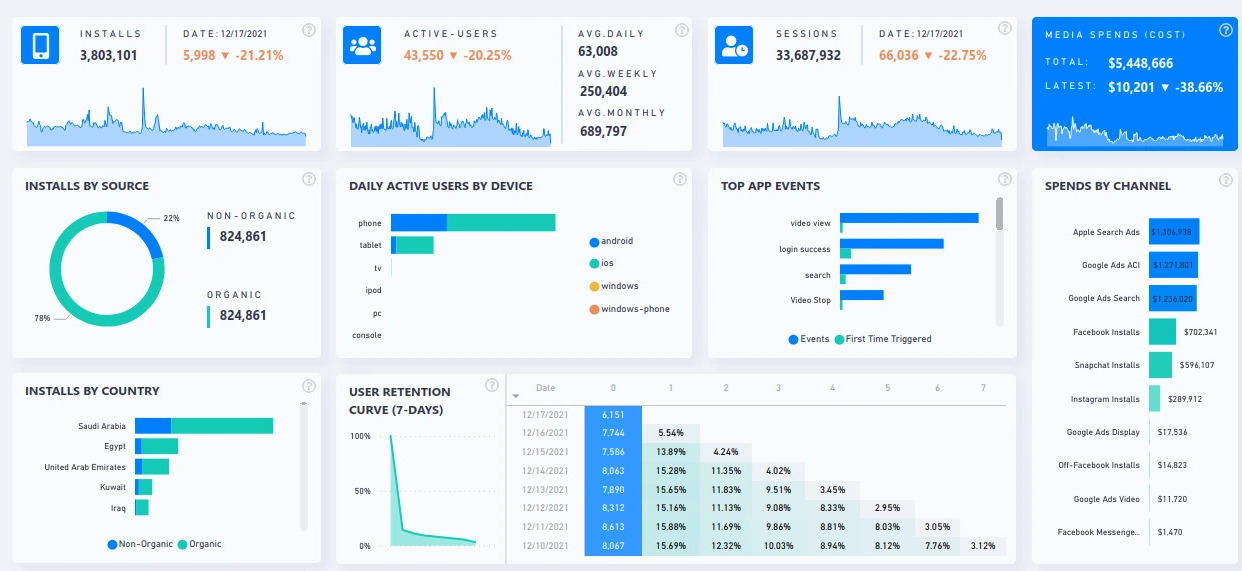
Mobile App Performance Dashboard
Designed a detailed app performance analytics dashboard in Power BI. Tracked installs, sessions, retention, and user engagement by device, country, and source. Included cost analysis by ad channels and key metrics like DAU, WAU, and MAU for marketing and product teams.